Malware Analysis of a malware sample using the Process Hollowing technique
In this blog, I will present the analysis of a malware sample that turned out to be a ransomware. I will start with static analysis, at the beginning quickly analyzing the PE header and then using IDA to spot relevant parts inside the sample. After that, I will do dynamic analysis to try to validate my conclusions by running the sample in a debugger and looking at the changes that it introduces in the environment.

Static Analysis
I will start from the static analysis of the sample. I have prepared a airgapped Windows VM in order to avoid any possible malware spreading or communication to C2.
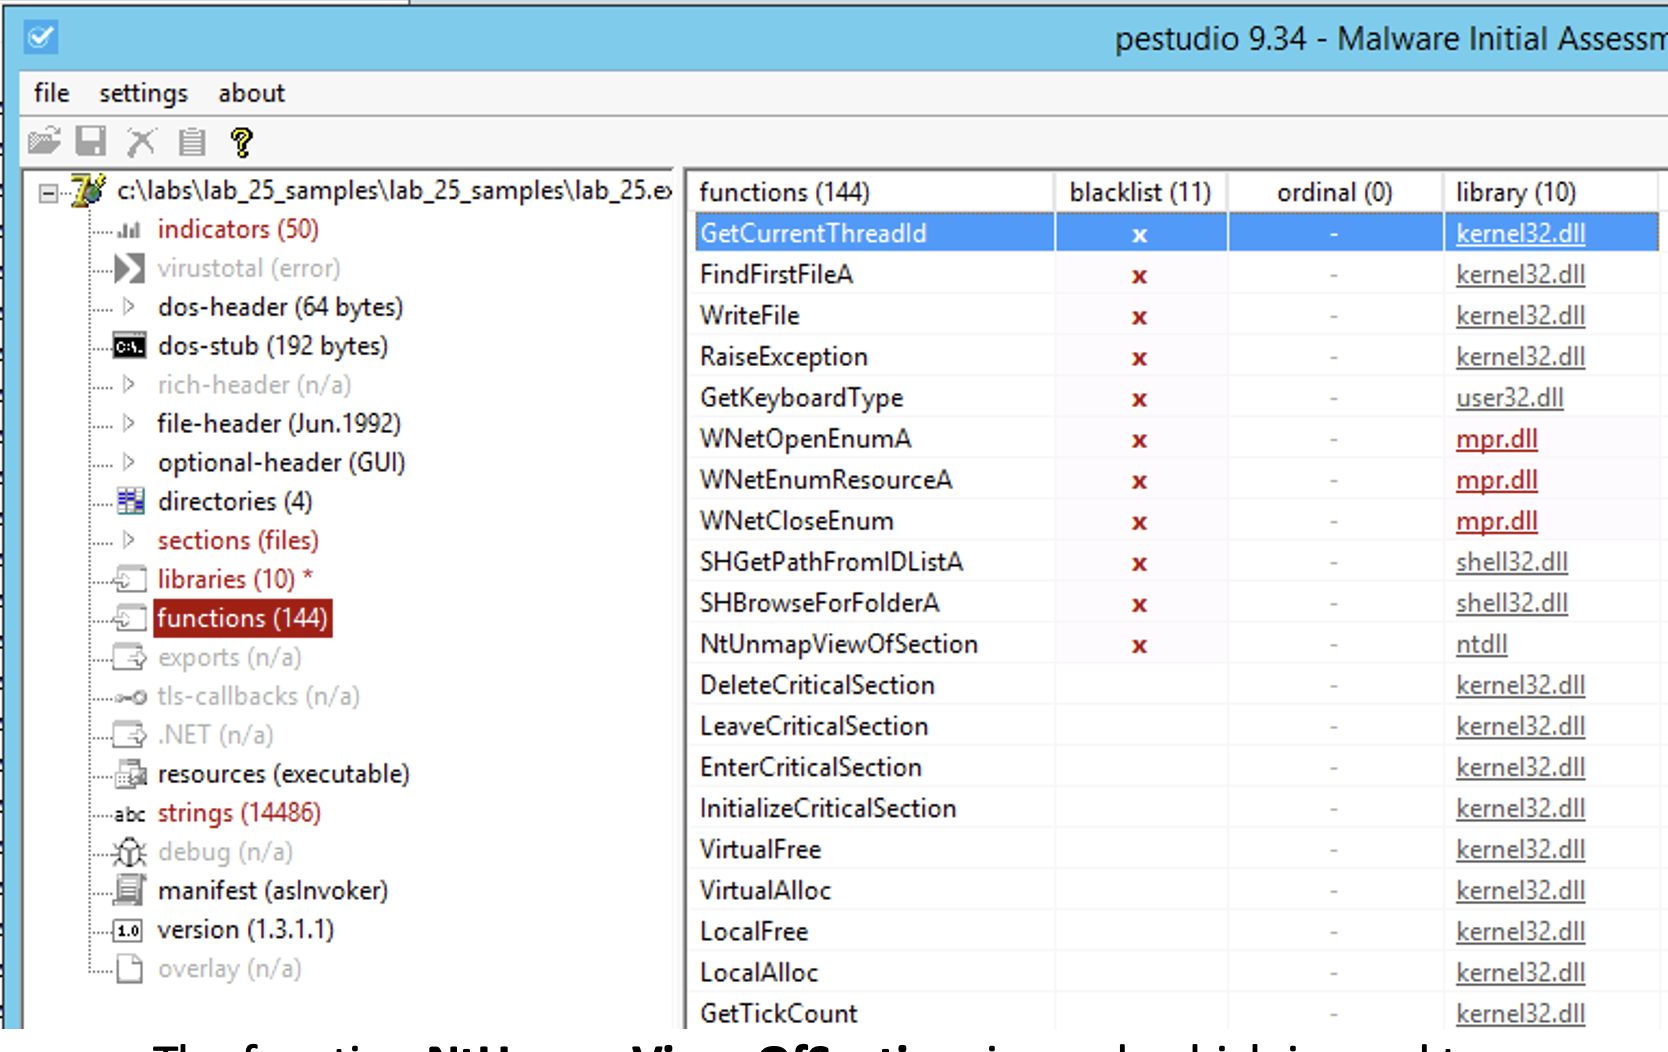
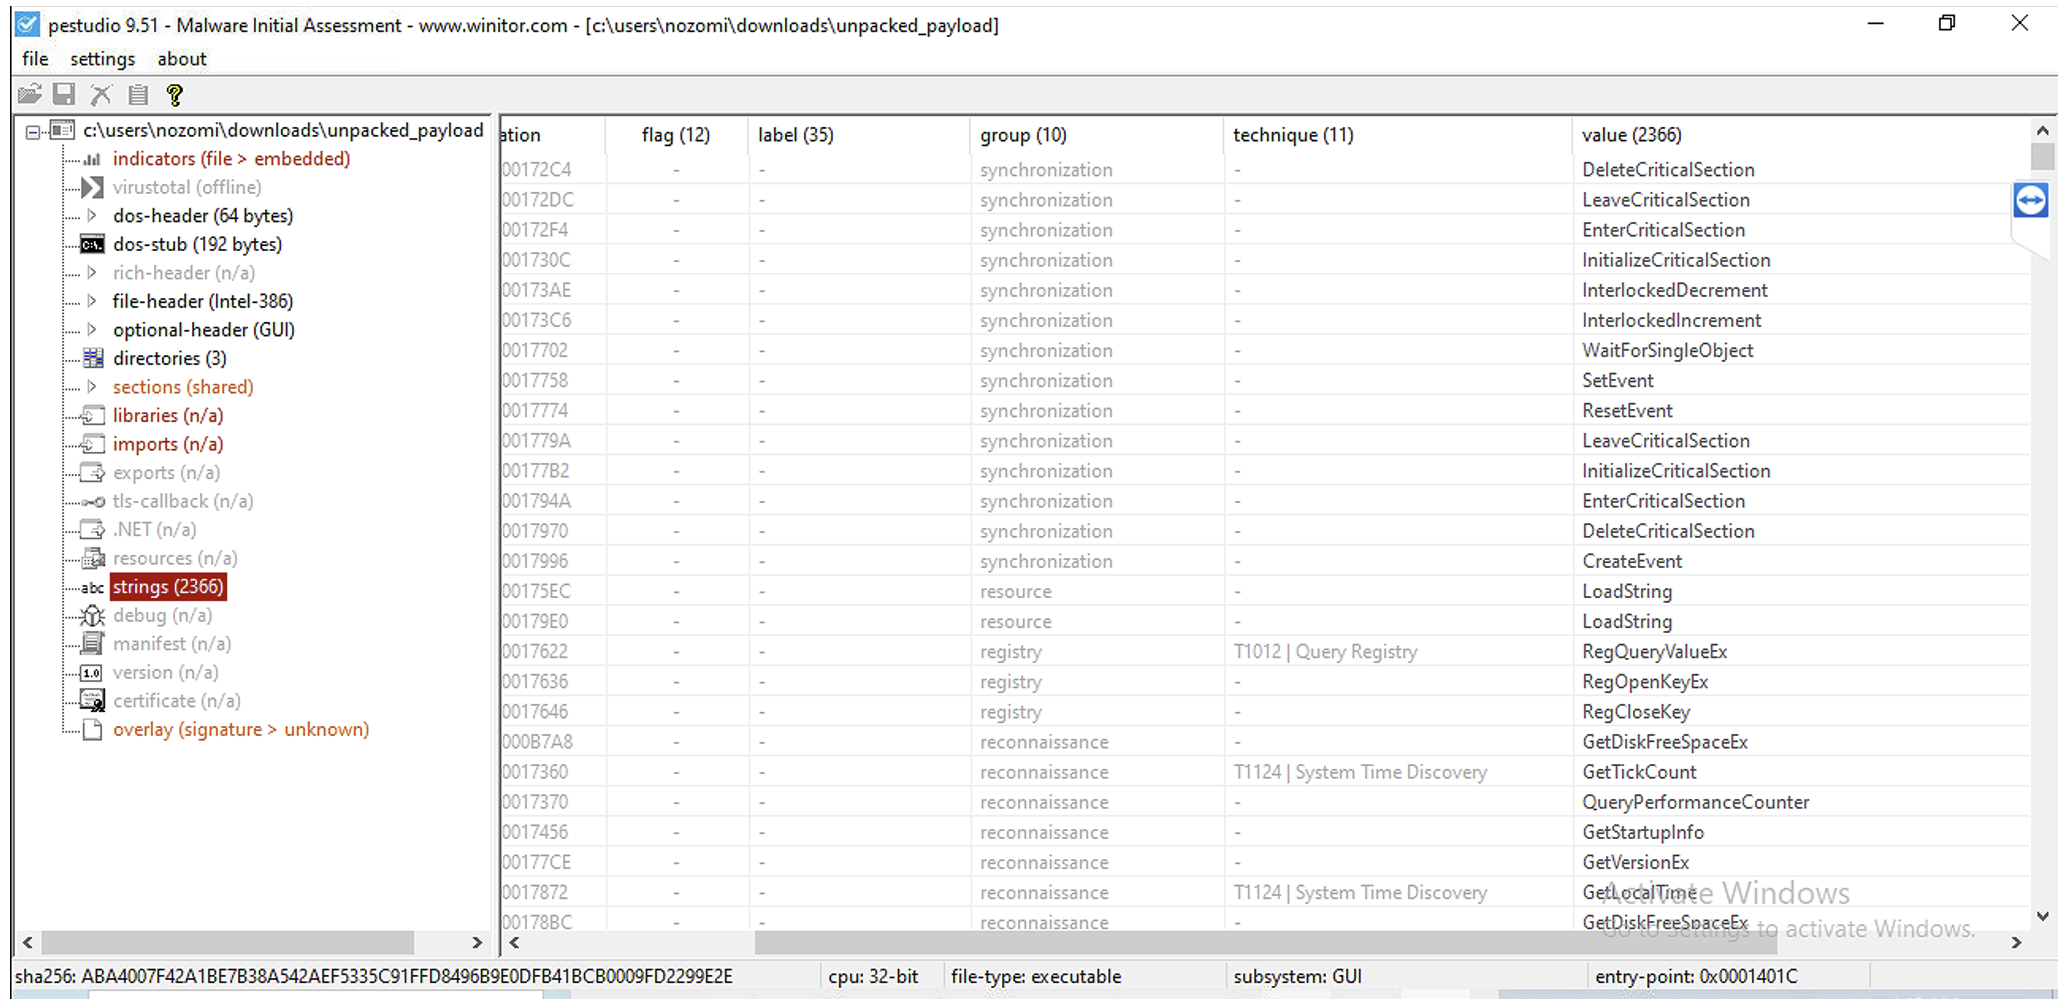
I copied the sample in the VM. It is an executable file, so I loaded it into PE Studio in order to analyze the PE header and see if I can get some useful insights.
I see that it is a 32 bit executable, a GUI application. Also, the language is set to Russian, which could be a bit weird, since the (simulated) target environment is not in Russia.
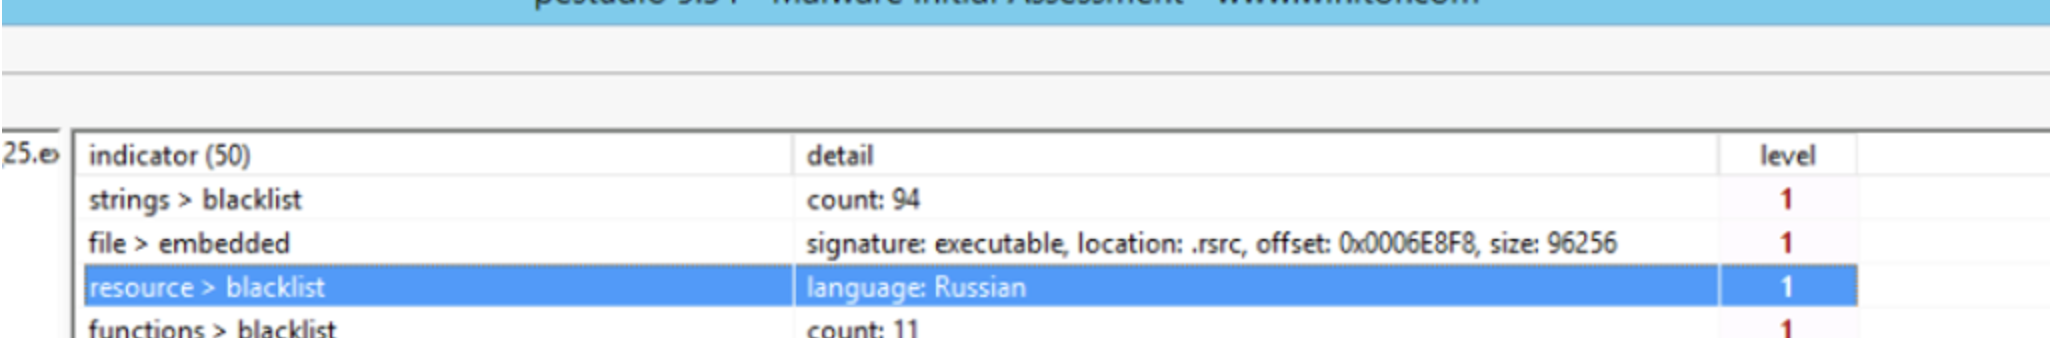
In addition to that, we can observe that there are some blacklisted function calls, for instance the ones related to enumerating network resources (such as WNetOpenEnumA).
What captures my attention however is the import of the function NtUnmapVirewOfSection, which is used to remove some pages from the process address space.
It is a function used in conjunction with process hollowing technique: the process unmap some pages from memory belonging to a legitimate process, and injects its malicious code into
target process memory.
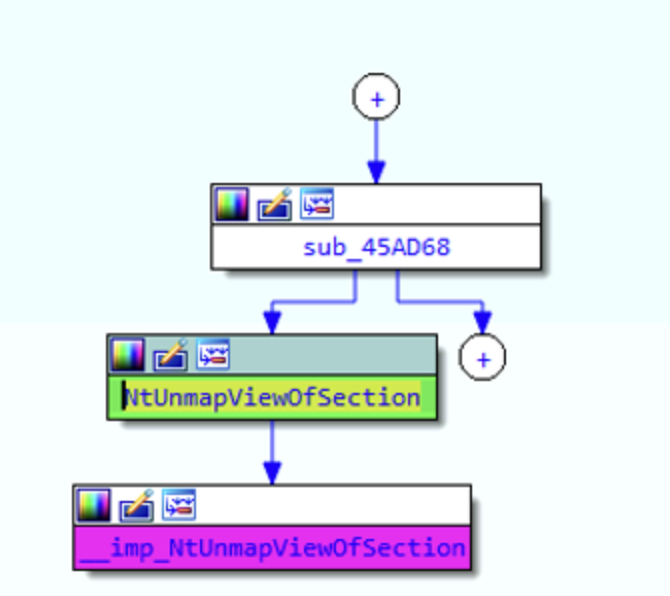
I decide to analyze the sample with the help of IDA. After poking around to get an idea of how the sample is built, I decide to directly pass to the code sorrounding
NtUnmapViewOfSection. Using the proximity browser, is it possible to see that this function is called by the block sub_45AD68.
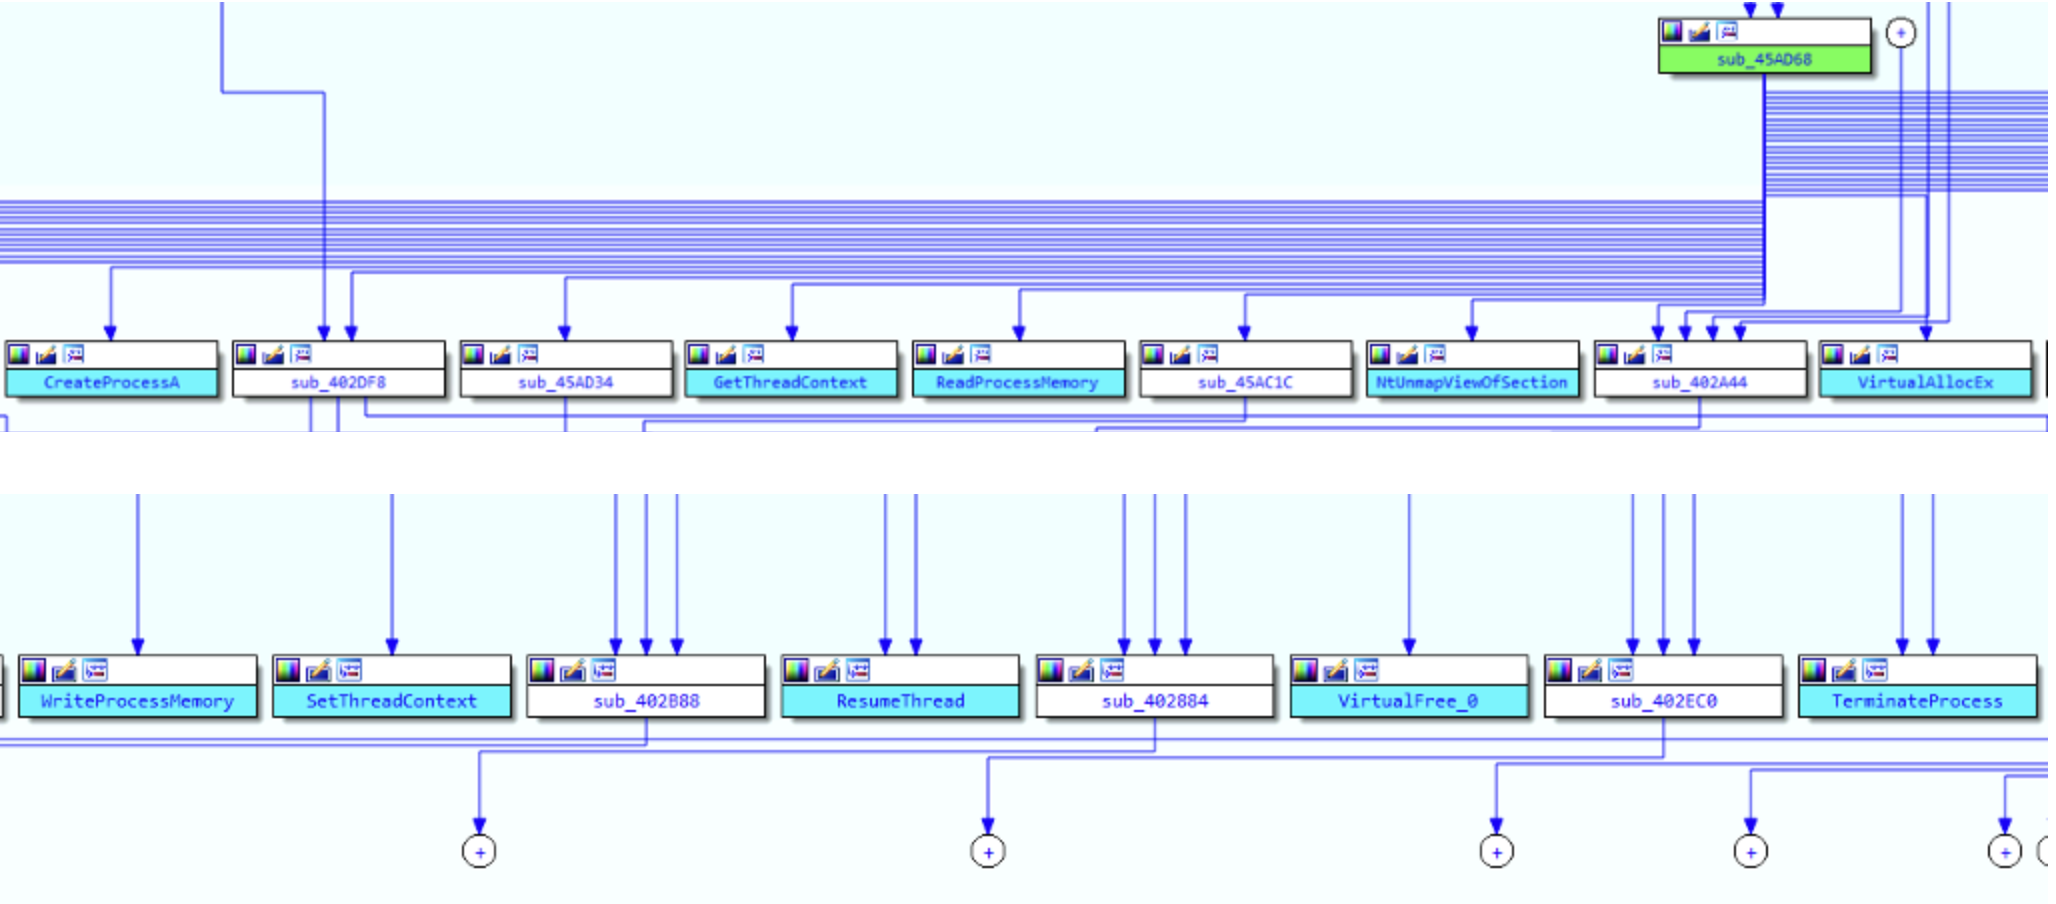
Cool, so at this point it is convenient to dig deeper into sub_45AD68. I expandended some of the collapsed modules in the proximity browser,
and I was able to see that a lot of functions generally involved in process hollowing techniques are present here:
◦ CreateProcessA: Probably used to create the new legitimate process that will be hollowed out. The parameters should be checked because in case of ProcessHollowing, the new process will be created in suspended mode.
◦ GetThreadContext: Retrieves the context of the specified thread (registers values, thread state, etc..). Needed to resume execution afterwards.
◦ ReadProcessMemory: Memory is read from a location and written to the provided buffer
◦ NtUnmapViewOfSection: This is the original suspicious indicator. This function call does the memory unmapping, freeing memory in the target process that will be filled with malicious payload
◦ VirtualAllocEx: Allocate the same space in memory for the malware PE image
◦ WriteProcessMemory: Write the malware executable in the memory space just allocated
◦ SetThreadContext: Set the new entrypoint, to allow the execution of the loaded malware
◦ ResumeThread: If the new thread was created in suspended state, this function call is used to start the execution.
In case of Process Hollowing technique, the execution is started only after the malicious PE image has been loaded into
the newly created process and the entrypoint has been updated to point to the injected image.
◦ VirtualFree: Used to free memory pages in the virtual address space of the calling process. It is not directly related to the Process Hollowing technique, because it unmaps memory of the caller process and not of the newly created process.
Furthermore, we strongly suspect that NtUnmapViewOfSection is used to unmap the memory of the target process.
◦ TerminateProcess: Terminates the original malware process? Will have to check if the malware is going to only leave the child process in execution.
Below you can find a screenshot from IDA showing all these functions being called by sub_45AD68
So let’s analyze the function sub_45AD68, which I renamed PROC_HOLLOWING in IDA.
The process is created in Suspended State, which is an indication of the process hollowing strategy. Indeed, dwCreationFlags is equal to 0x4, which corresponds to the CREATE_SUSPENDED process creation flag (https://learn.microsoft.com/en-us/windows/win32/procthread/process-creation-flags).
For what deals with the process that is actually created, lpApplicationName is 0, which means that we can retrieve the name of the spawned process by looking at lpCommandLine. Here the value of this latest flag is given by the value of EAX, so we will check its value at runtime using a debugger.
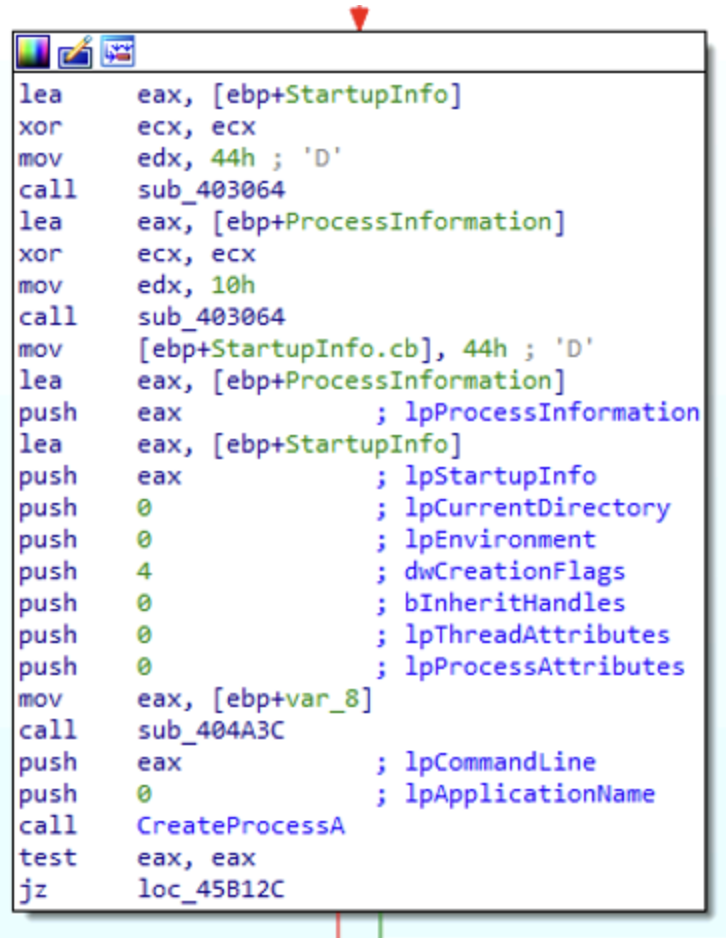
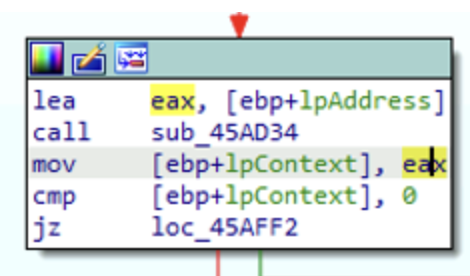
Following the execution flow, the next interesting function called after CreateProcess is VirtualAlloc: from the parameters we see that it is commiting 0d0x hex bytes in memory with Read/Write access.
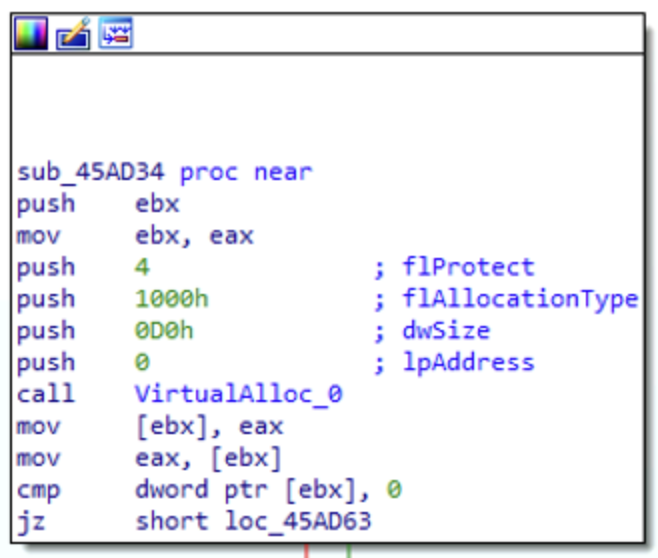
It seems that these memory pages contain the CONTEXT structure and are used in the next call to GetThreadContext:
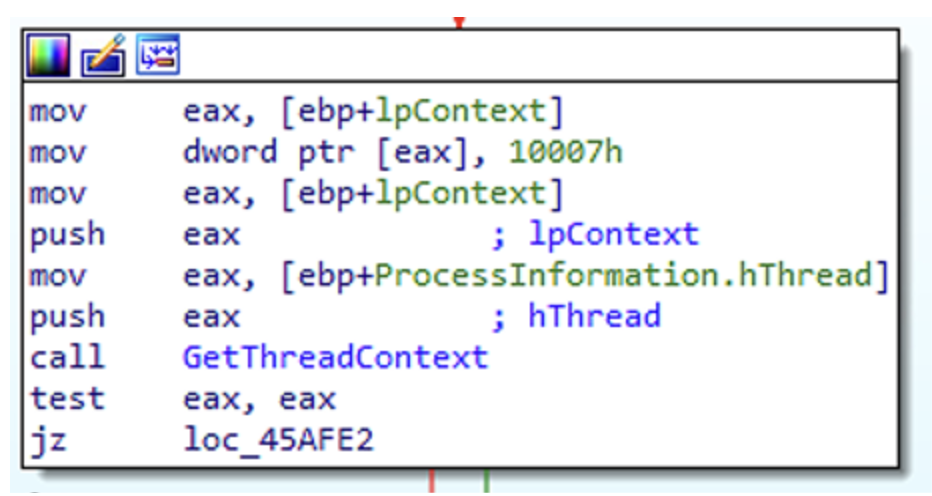
Then we reach the GetThreadContext call: the thread whose context we’re retrieving is specified in ebp+ProcessInformation.hThread, while ebp+lpContext will receive the content of the retrieved context. It is likely that the memory commited before, is used to receive the CONTEXT data structure.
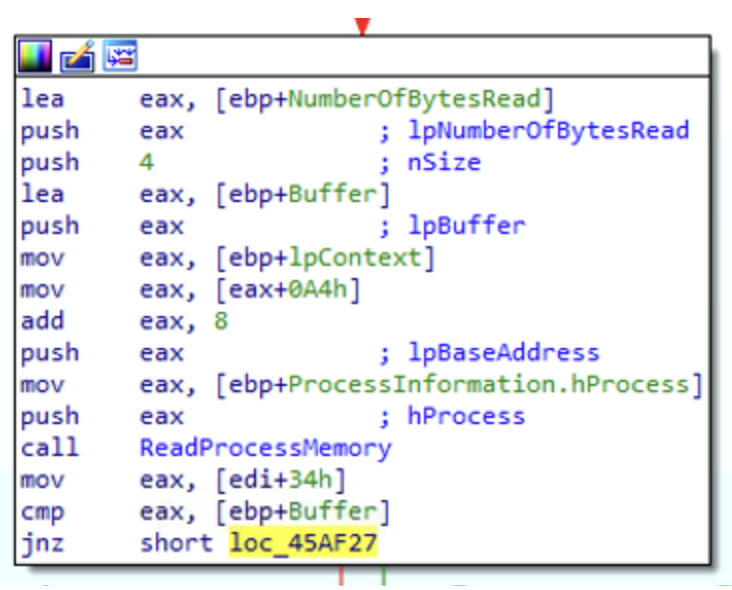
The next function called is ReadProcessMemory. In this case, four bytes are copied into [ebp+Buffer]. After that the copy is executed, this value is compared against
what is stored in [edi+34h]: if they are equal, then the execution flow will call NtUnmapViewOfSection to unmap memory pages in the target process and then VirtualAllocEx,
otherwise it will directly call VirtualAllocEx.
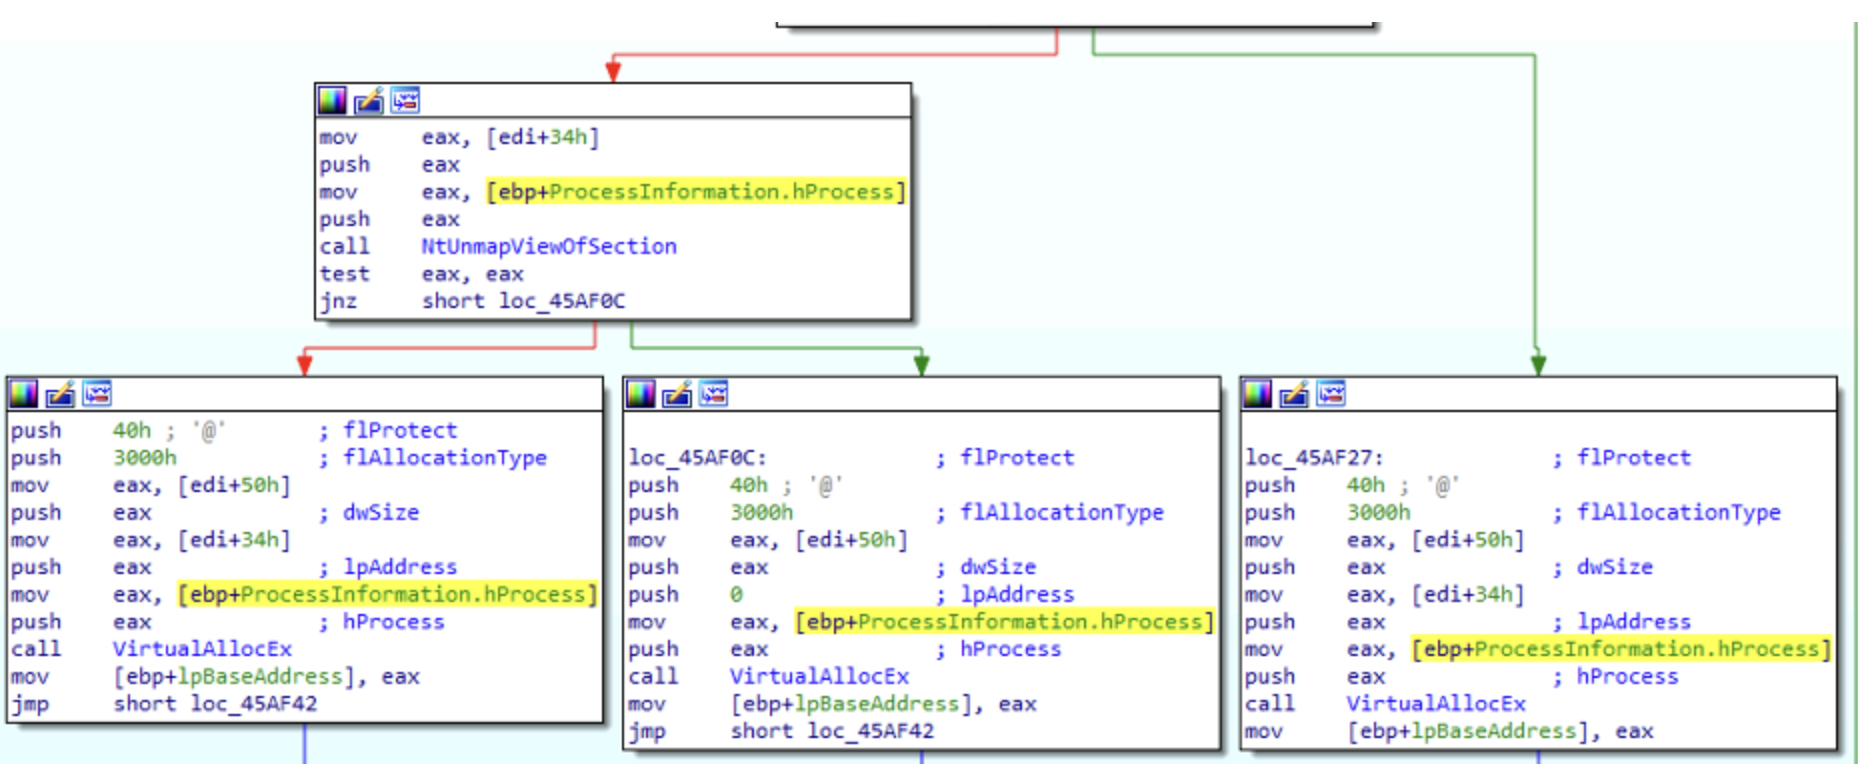
One interesting thing to note, is that if NtUnmapVIewOfSection executed successfully, the VirtualAllocEx is called with the parameter lpAddress equal to [edi+34h], which instructs Windows to allocate memory
starting from the specified memory location, which corresponds to the pages unloaded in the target memory process. On the contrary, if NtUnmapVIewOfSection failed, then the pages in memory were not successfully
unmapped, and so in this case the function VirtualAllocEx is called with parameter lpAddress equal to zero, meaning that the function itself will decide where to allocate memory in the target process.
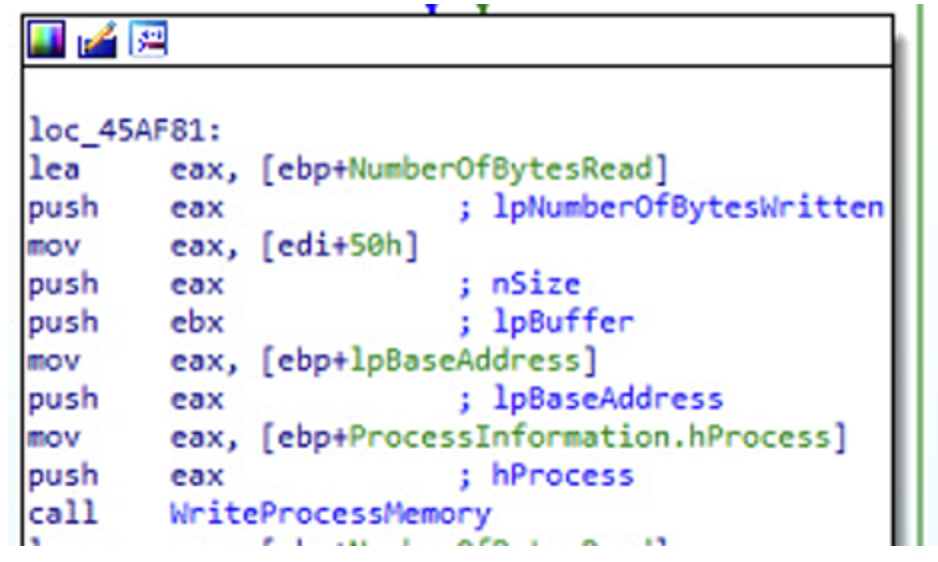
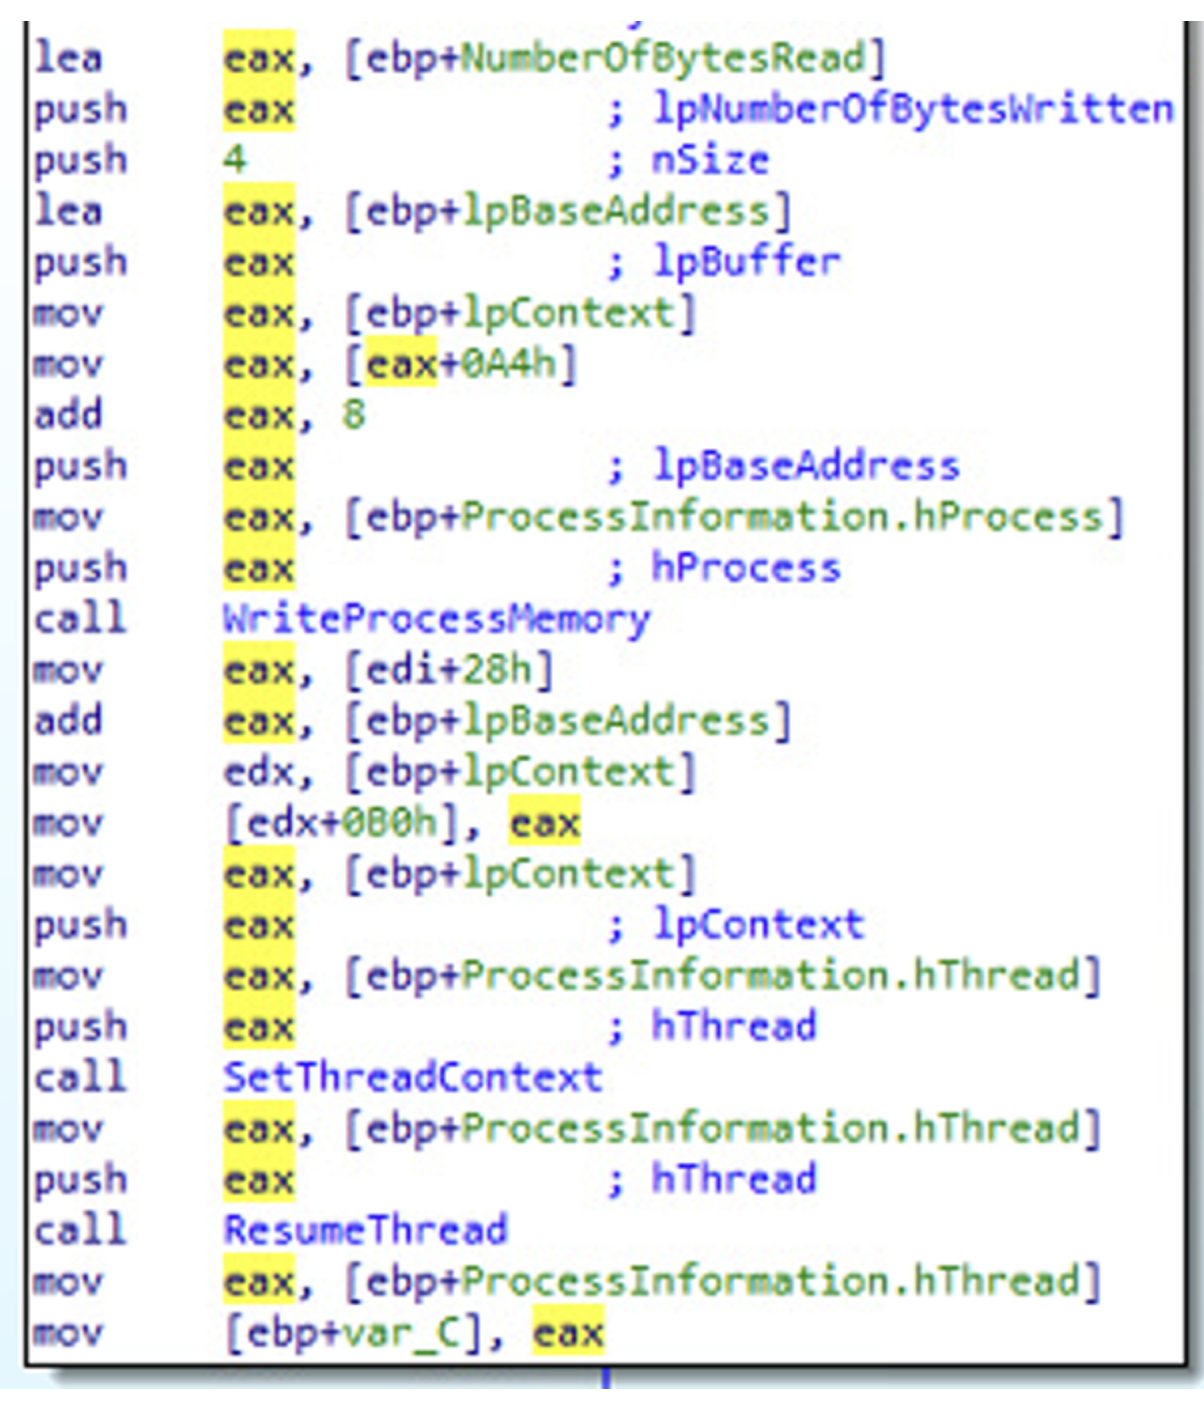
Then if the memory allocation succeeded (return value of VirtualAllocEx is not zero), the execution flow approaches the end. Two WriteProcessMemory operations are executed, where the second one writes
four bytes into the previously retrieved Context object: maybe an address is written to update the new thread's starting point to the malware's entry point (we'll better check what these two write operations do
with the help of a debugger).
After the CONTEXT object is modified, this object is passed to SetThreadContext to set the new context of the thread. Finally, the ResumeThread function gets called to start the execution of the newly created
thread, which should now carry the malicious payload.
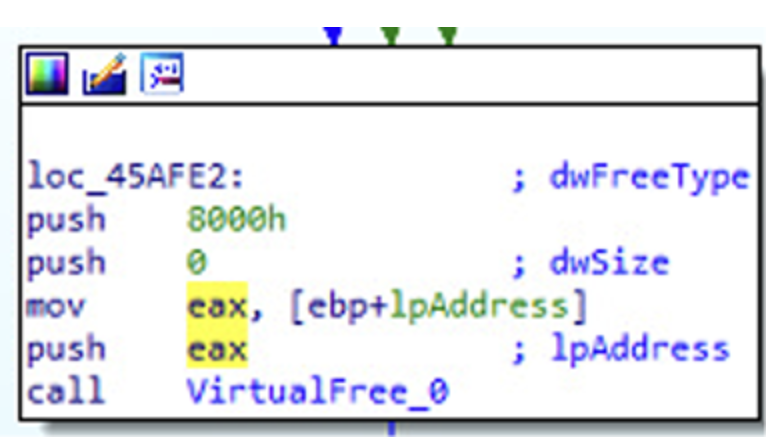
After that, VirtualFree function is called, to release the region of pages previously allocated by the VirtualAlloc function, starting at address lpAddress.
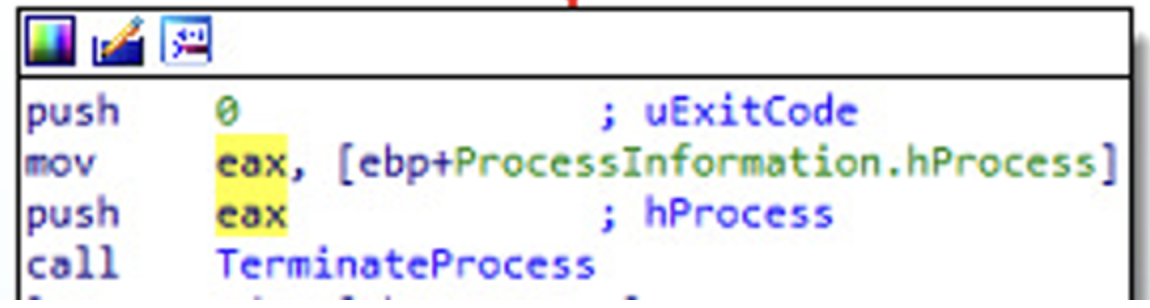
Then, the process is terminated without errors (exit code is zero).
Dynamic Analysis
After starting to dynamically analyzing the sample, I noticed that simply running the executable from the debugger is not sufficient to trigger the process hollowing technique,
since if we load the program into x32dbg and then execute it, we are lead to another, not interesting path of execution.
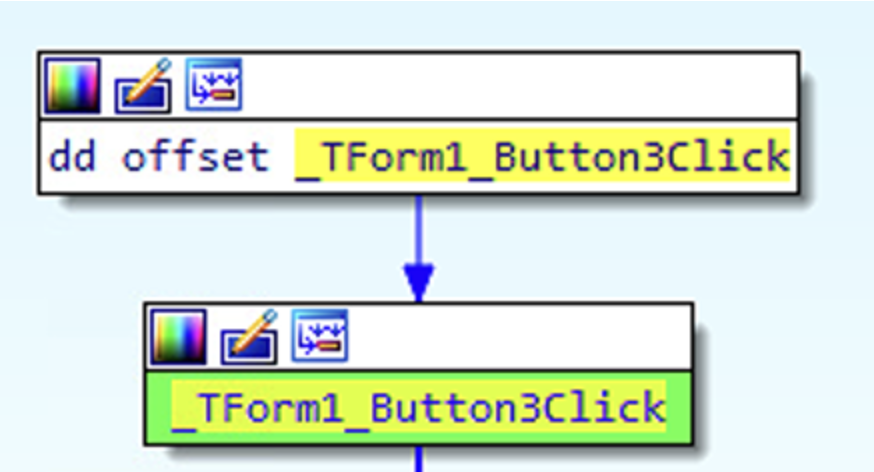
So I reanalyzed it with IDA and was able to determine that in order to take the expected path, we have to interact with the sample through GUI objects.
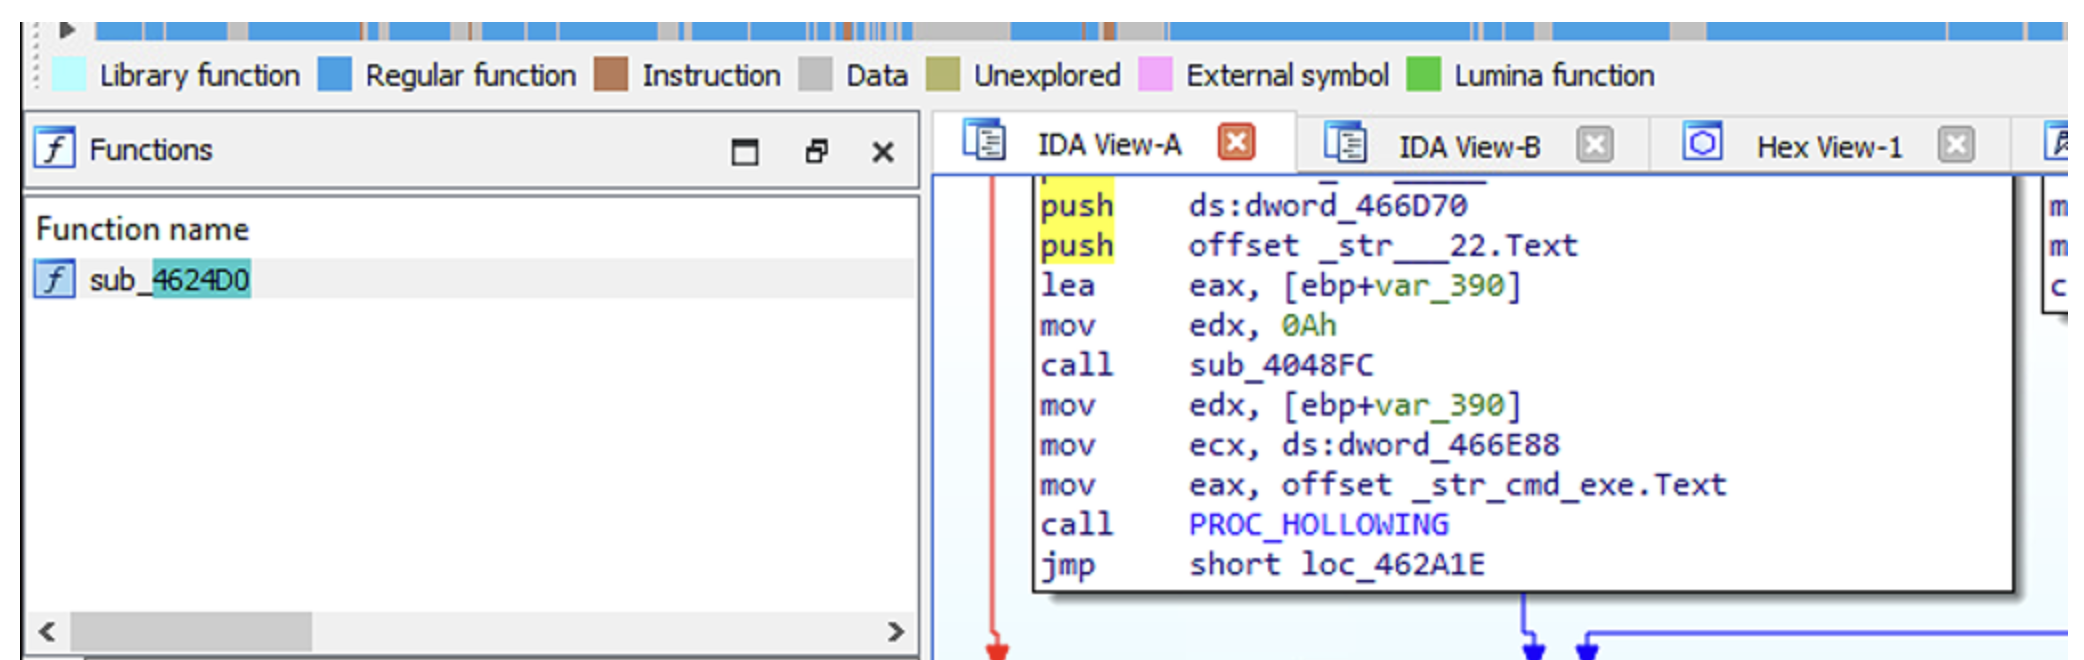
In particular, we have to perform actions on a button named _tForm1_button3Click. This in turn will lead to the code block called SUB_4624D0,
which will eventually call the code block where process hollowing is done (PROC_HOLLOWING code block).

So, in order to analyze this execution path with the x32dbg debugger, I set a breakpoint at address 462CAC, which corresponds to the starting virtual address of _TForm_Button3.
After that, I start again to interact with the malware sample. The malware is a GUI application, and after a few trials it turns out that the button that we are looking for
is the one labelled as Start.
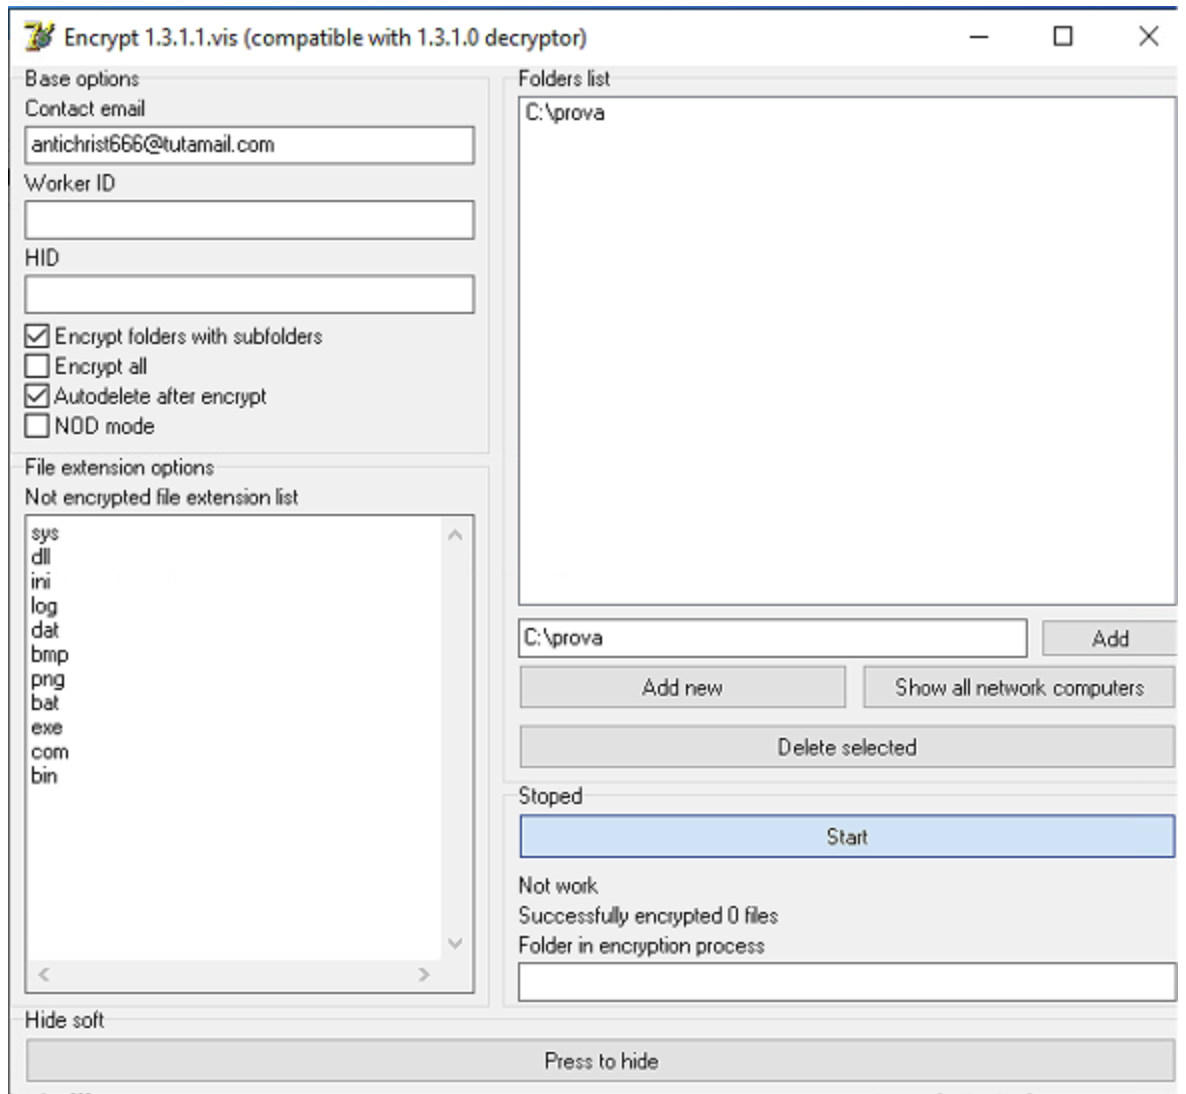
After clicking start, the breakpoint that we have set is triggered, so we are now in the flow of execution that we were interested into.
At this point, I also put a breakpoint at the beginning of the function that I renamed PROC_HOLLOWING in IDA (at the virtual address 4629E0), and continue the execution.
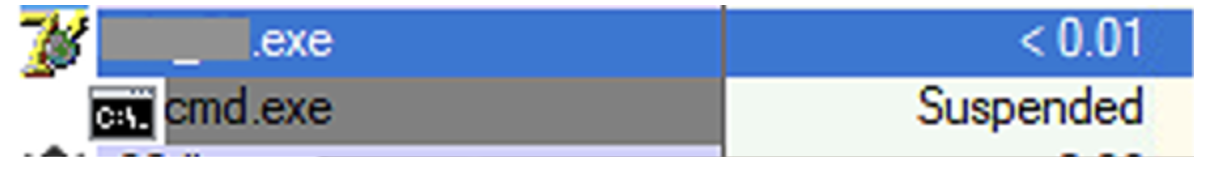
The first hit breakpoint is the one on function CreateProcessA. As we saw in IDA, the process to be created is passed in the lpCommandLine parameter, and we can now see that the
command is a command prompt used to delete the original file on disk.

This is probably the process that will be hollowed out and indeed, if we check with Process Explorer we can see that the process is created in suspended mode, which
is what we expected from static analysis:
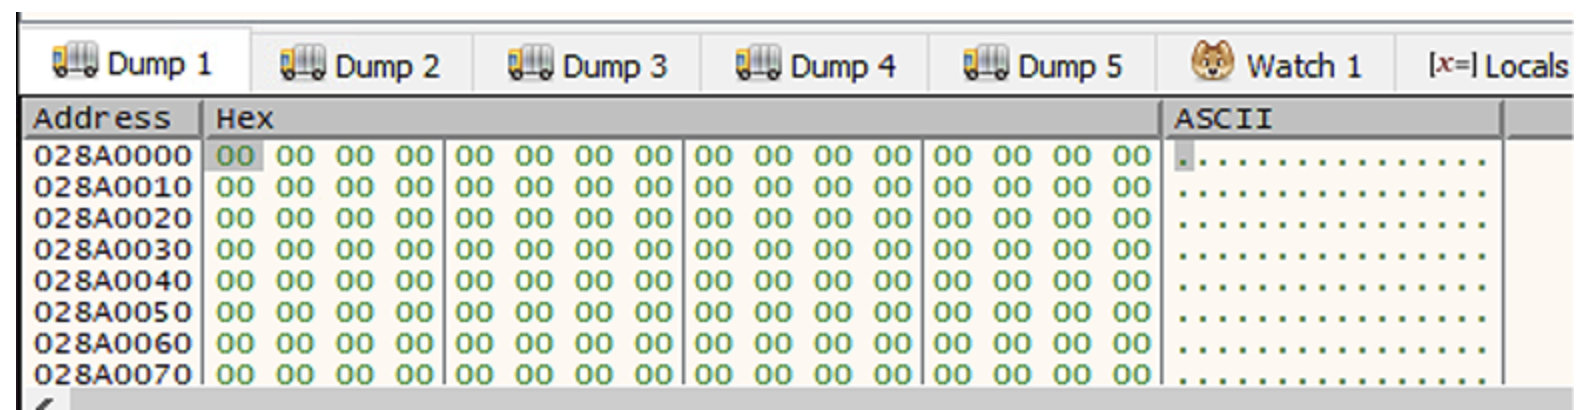
Going on with the execution, we find VirtualAllocA: D0h bytes are allocated and indeed if we check the memory location pointed by EAX, we can now see that it is full of zeroes.
Then GetThreadContext is called. In this case the execution is straightforward, the function returns a value different from zero in EAX, meaning that the context object
was successfully retrieved.

After that, the execution continues until ReadProcessMemory, which copies the four bytes 00004000 into the memory location at address 19F3D4.
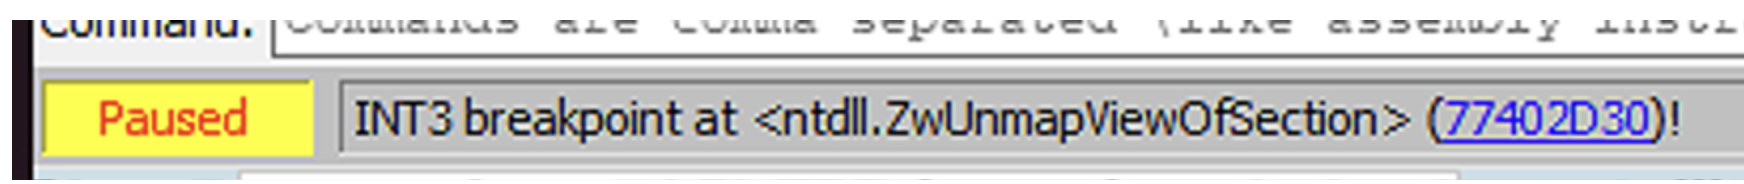
Then, function NtUnmapViewOfFunction is called to unmap memory pages in the target process in order to substitute them with the injected PE image.
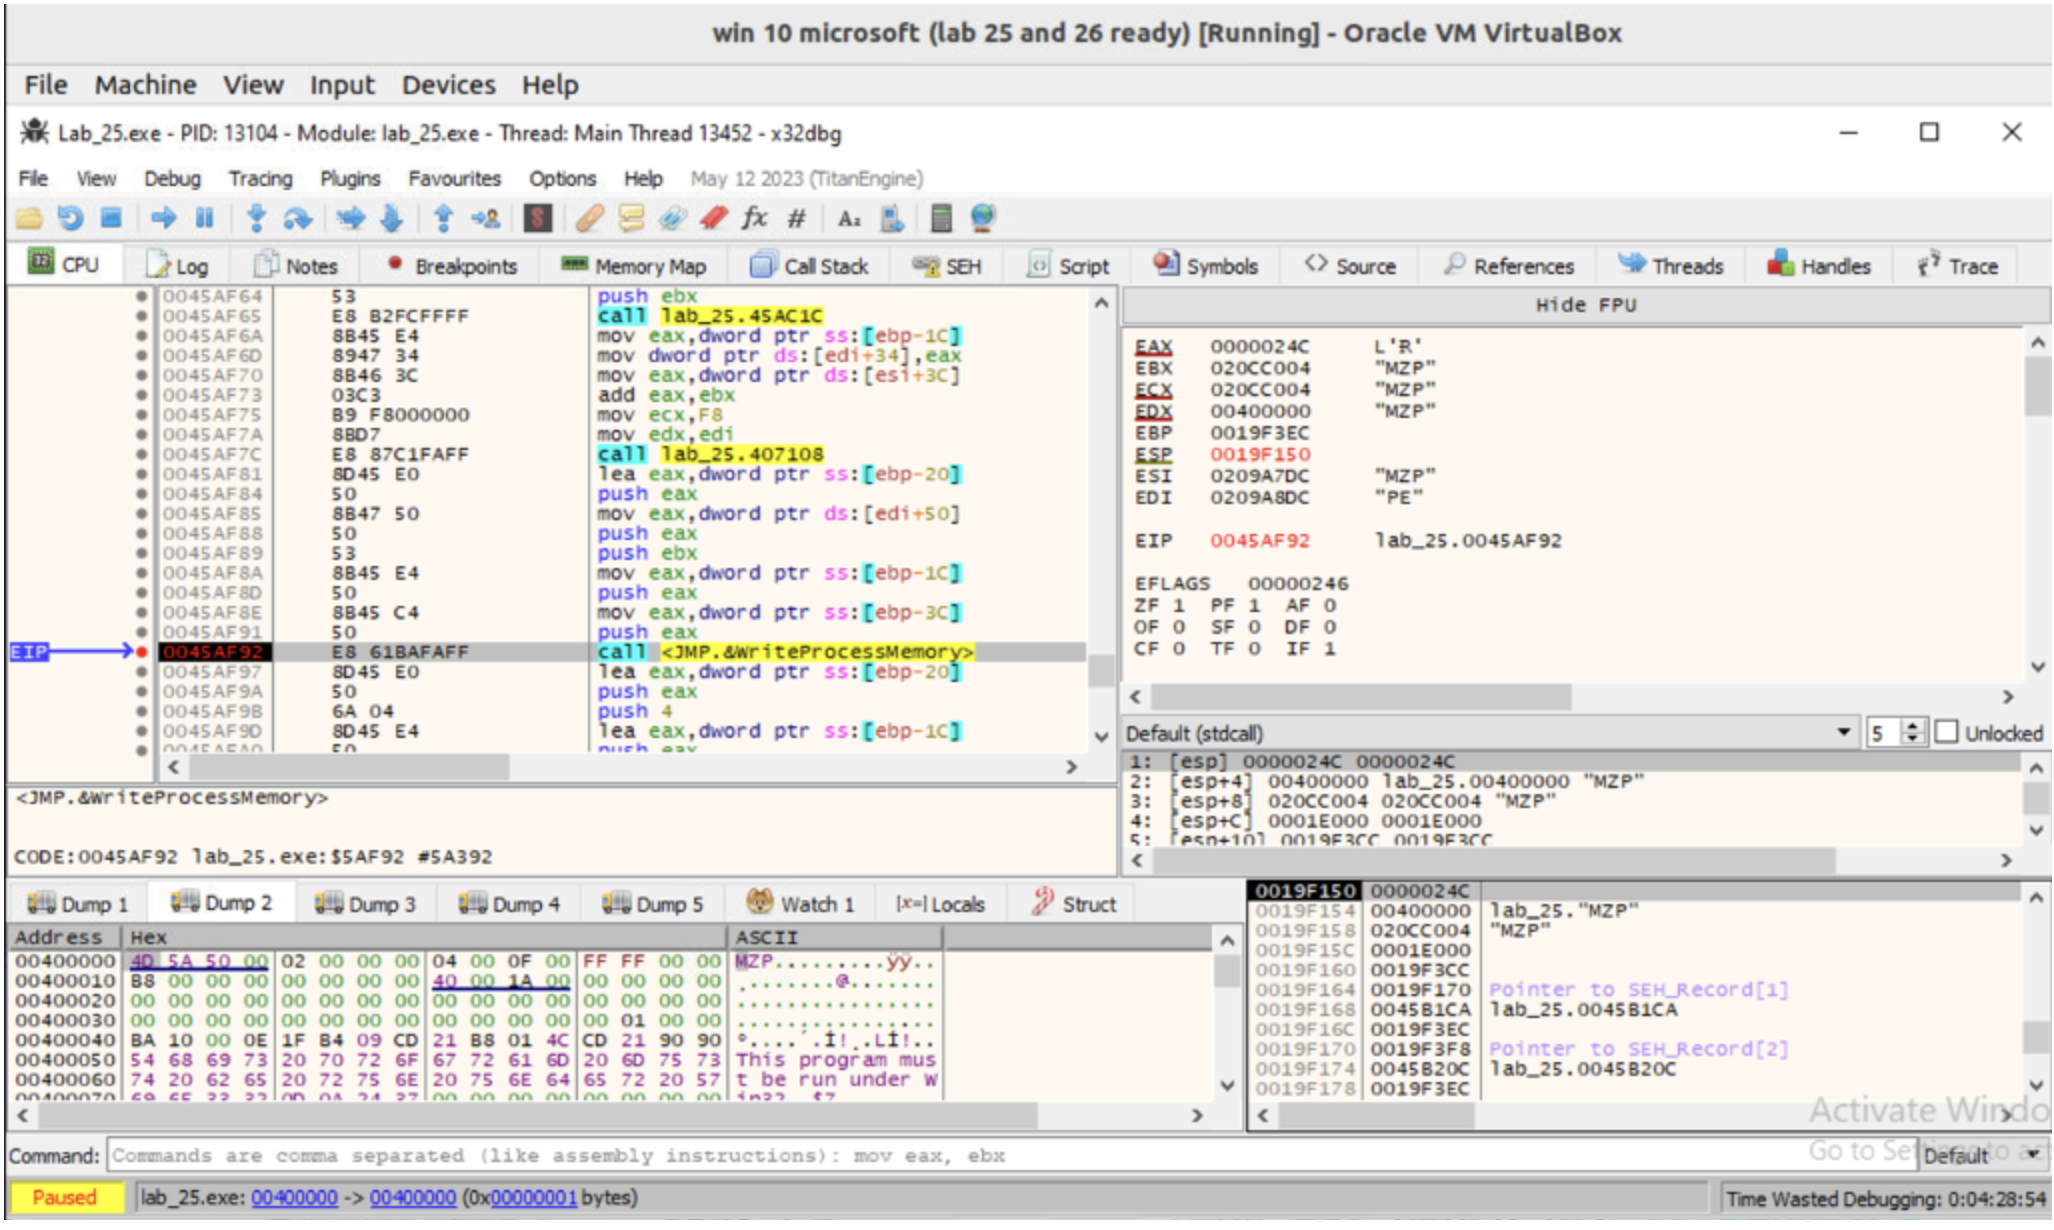
The malicious PE image is actually copied to the target process by the WriteProcessMemory function at address 0045AF92.
Indeed, we can see that memory locations starting at 00400000 are going to be overwritten with data at memory location 020CC004.
By the way, the value 00400000 is the one that was previously copied by the function ReadProcessMemory.
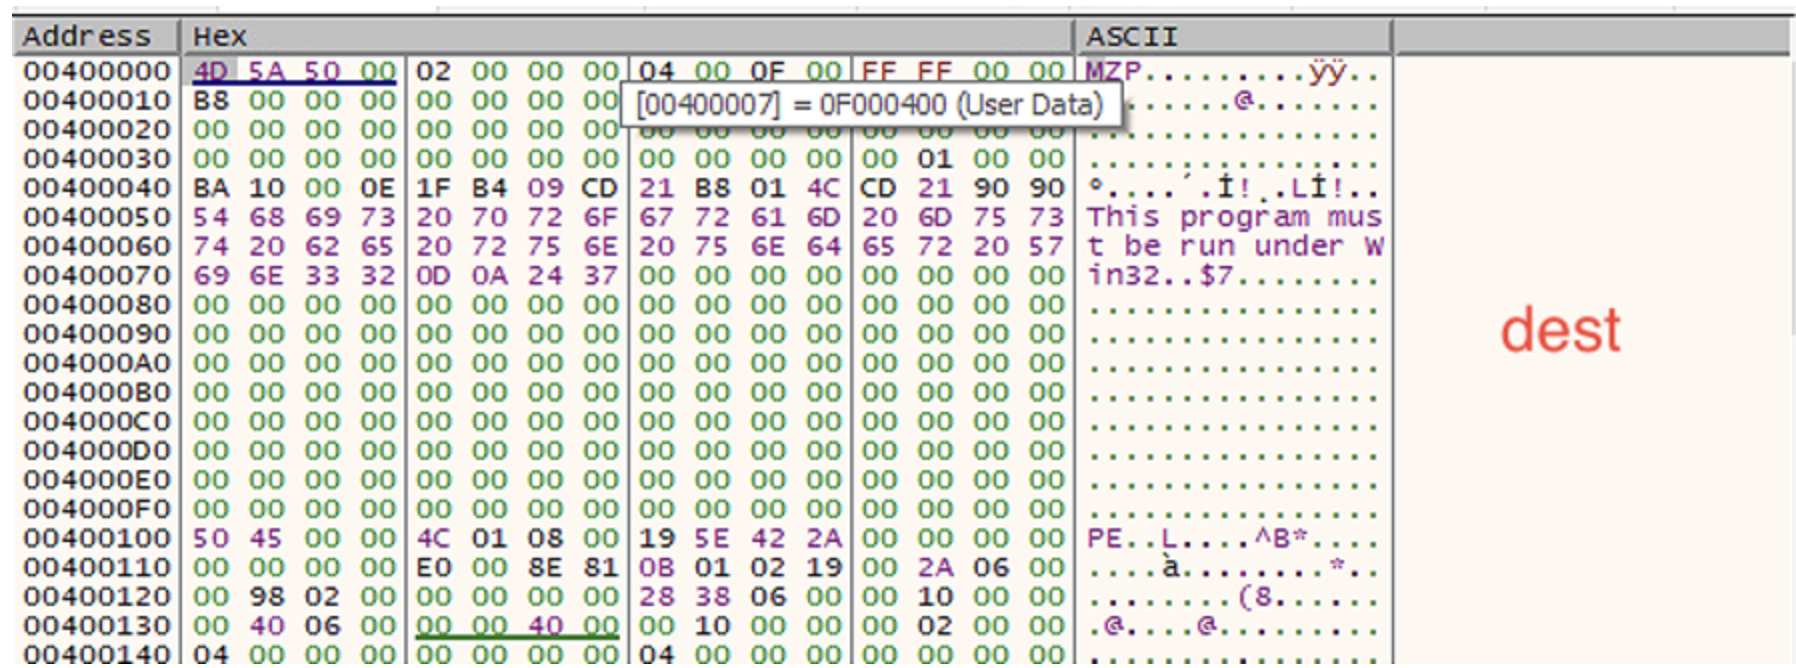
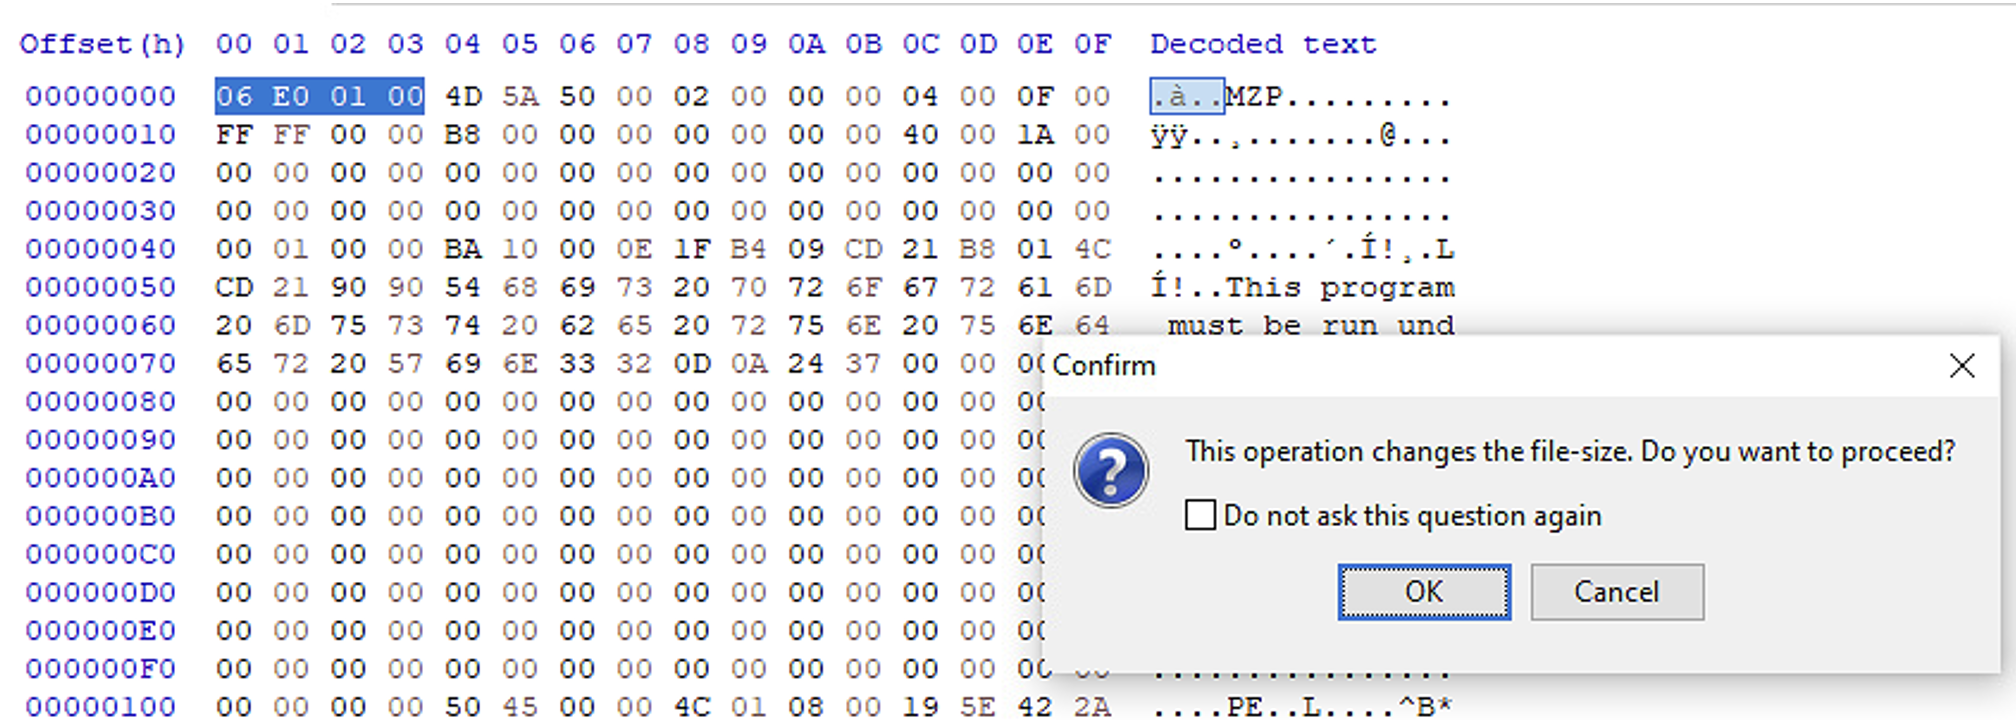
Let's take a look at address 00400000, which is the one that will be overwritten: we can see that it contains a valid executable (notice the MZ magic value and the PE header).
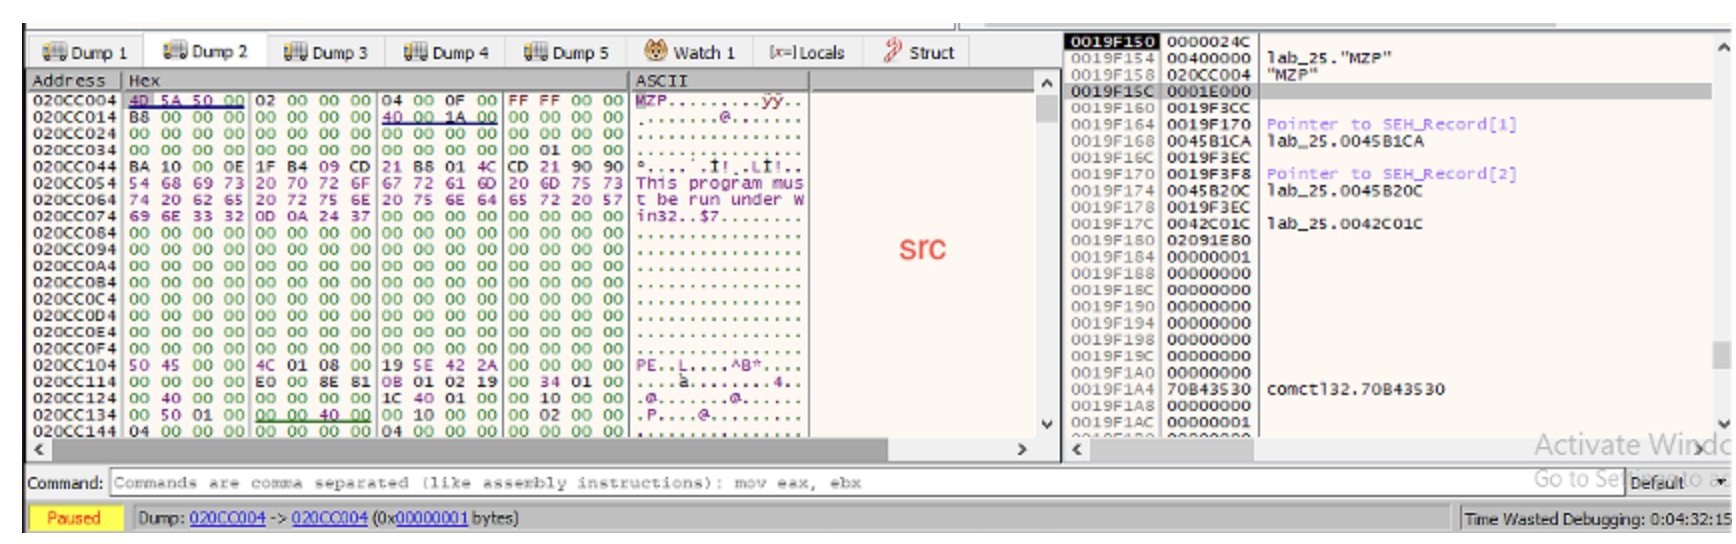
Now let's take a look at the memory addresses that are going to be copied: we can see that they constitute a valid executable as well. This executable, is the one that will be
injected into the target process. Let's unpack it!
Bonus: Malware Unpacking
At this point I want to unpack and analyze the sample that is loaded into memory.
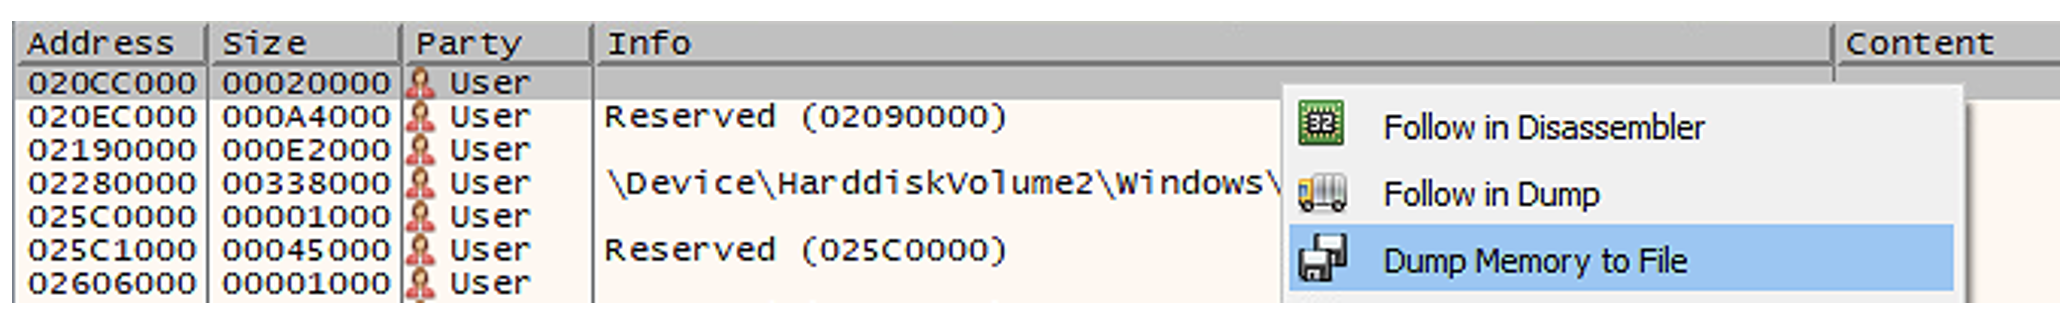
So, I export it from x32dbg, selecting the proper memory block, which is the one starting at 020CC000 (having size equal to 00020000 hex bytes = 131.072 bytes).
Now, since we know that the sample starts at address 020CC004 and has a size of 0001E000 hex bytes = 122.880 bytes, it means that we have to discard the first 4 bytes and
the last 131.072 - 122.880 = 8.192 bytes. I am going to use HxD tool to delete these bytes, and only keep the PE image file.
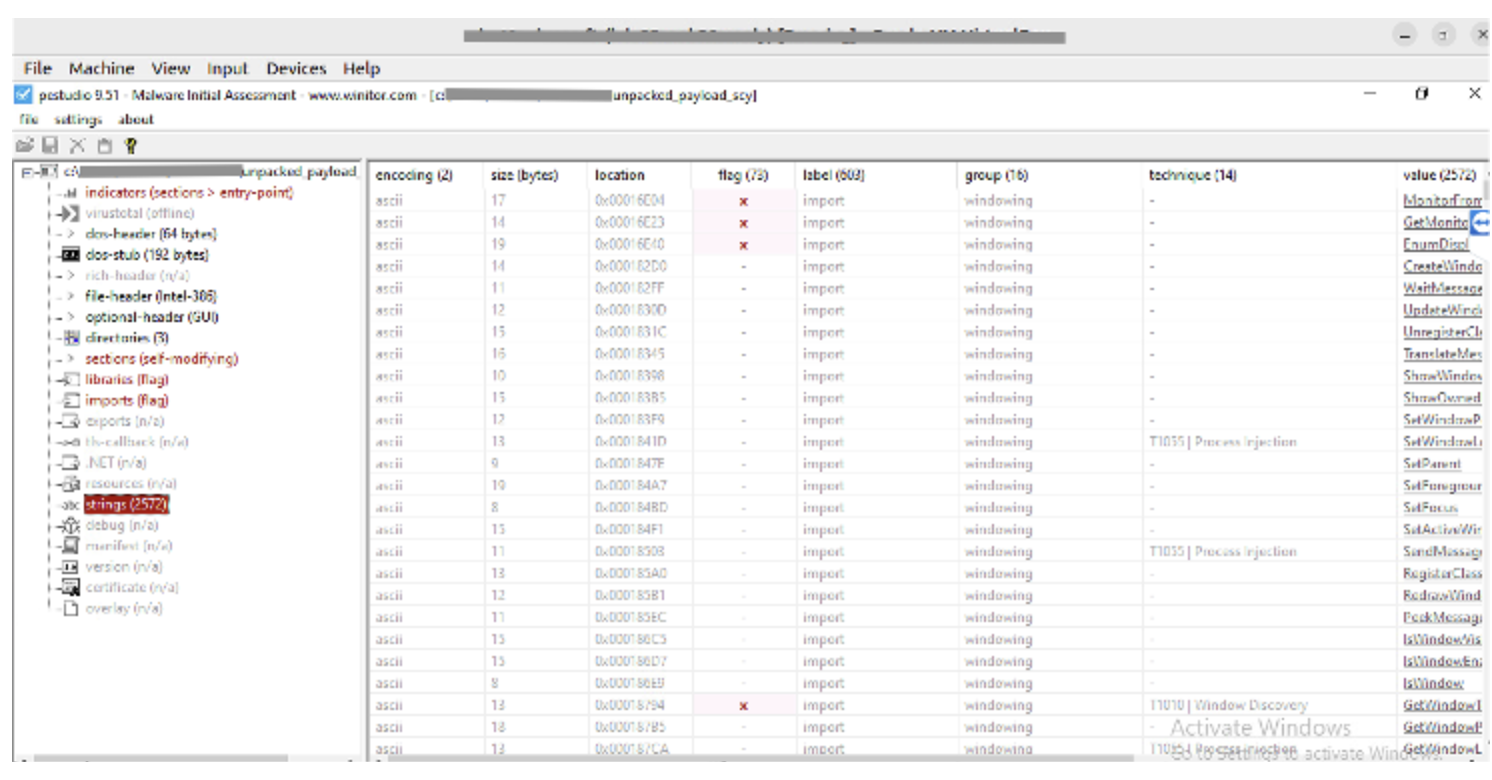
At this point the sample is unpacked and a valid PE file is recreated, however if we load it into a PE analyzer like PEStudio, we can see that it is not able to load libraries
and functions, because the import address tables have to be fixed.
So in order to fix the Import Address Table, we open Scylla, select the unpacked sample, and then click on Fix Dump.
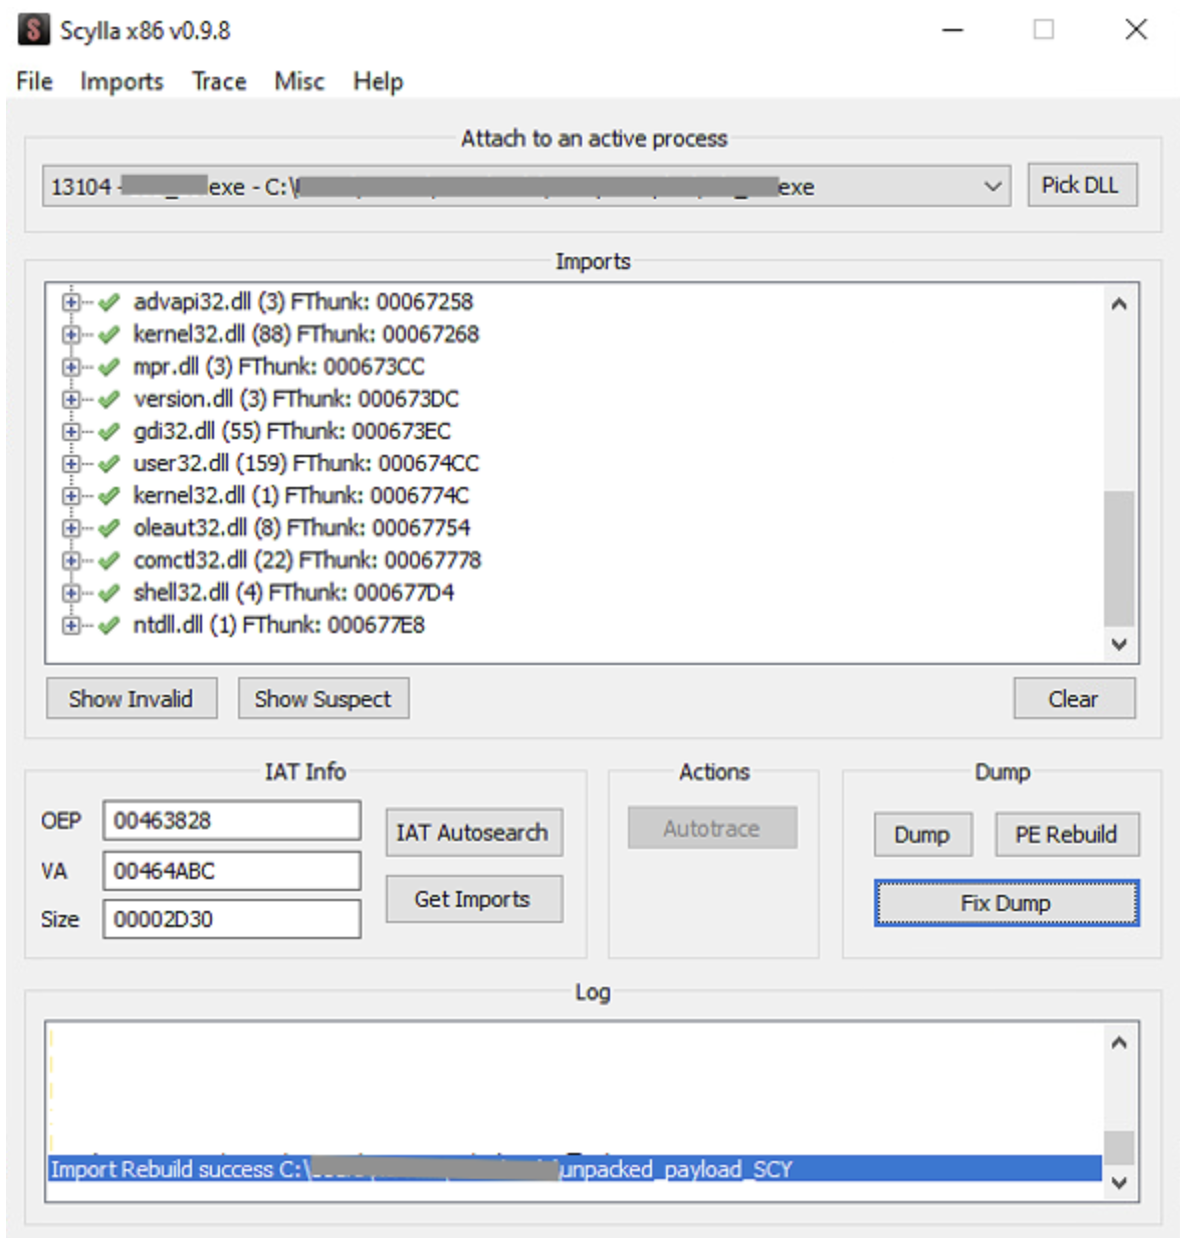
After that, we can see that the imports of the unpacked sample are correctly rebuilt:
Ok, after this parenthesis with sample unpacking, let’s resume the debug execution.
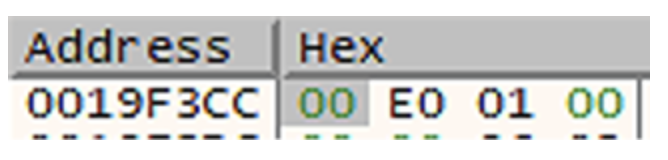
If we check the result of the previous WriteProcessMemory operation (address 0019f3cc holds the number of bytes written by the function), we can verify that the value has been
updated and matches the expected number of written bytes:
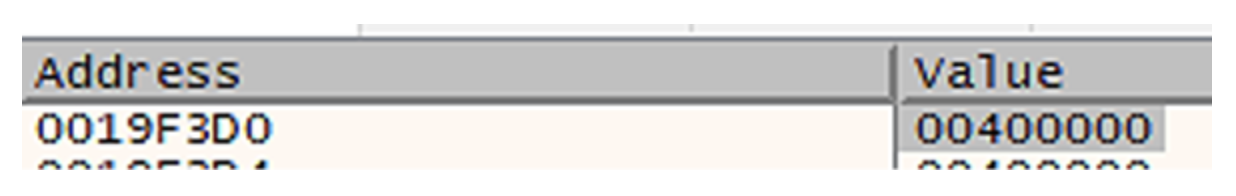
Then there is another WriteProcessMemory function call: in the case only 4 bytes are written at address 0019f3d0.
In this case, the target address is equal to 00 40 00 00 after the function call.
After that, SetThreadContext is called to modify the acquired context: indeed, the new entry point of the target process will be modified to point to the entry point of the loaded malicious PE image.
Finally, ResumeThread is called to start the execution of the victim process (which was created in suspended state).
The last instruction is ExitProcess, with which the sample terminates the execution.

Why you say it's a ransomware?
Well, because what this sample does, is actually encrypting files on disk. I did not highlight its nature because I was interested in analyzing the process hollowing technique,
however by running this sample, all the files in the target directory are encrypted.
The encryption happens before the code that we previously analyzed. The rationale is that files are encrypted on disk, a message is left onto the victim device telling how
to contact ransomware authors and finally the original malware sample is deleted from disk.
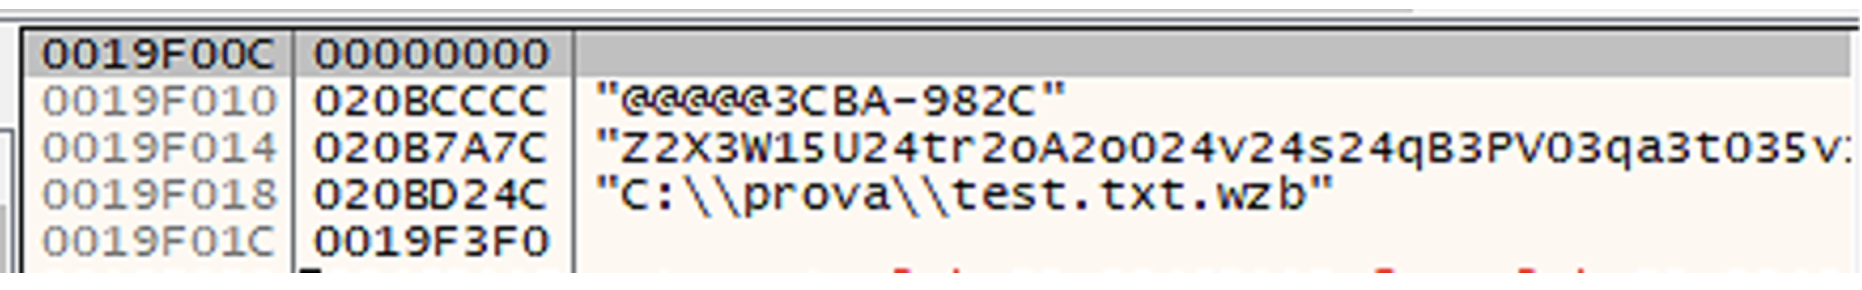
Below you can find a screenshot of the stack of the encrypting routine showing the content and the name of one encrypted file.
Conclusion
In this blog post we analyzed a ransomware implementing process hollowing technique. Our focus was on the technique itself and not on the ransomware nature of the sample.
We have seen from static analysis with IDA which are the functions involved in this technique and then we validated our hypothesis by running the sample in a
debugger and checking its parameters and return values at runtime. We also showed how it is possible to unpack the malware payload that is copied into the hollowed out process
for further analysis.